
4% Withdrawal Rule And Simulating Retirement Portfolios
Retirement And The Rule Of 25
Investors across all ages may be curious about their individual retirement goals, and the largest question of them all, is how much is needed for retirement. In this article, we wanted to discuss not only a quick and simple way to measure the approximate amount one might need at retirement but also, a study on the 4% withdrawal rule and how that has performed across different investment types.
First, let’s dive into what the rule of 25 is, and how it intertwines with the 4% withdrawal rate rule. The rule of 25 is simple, it states that an investor should have 25 times the annual amount they plan to spend in retirement as their retirement portfolio.
Let’s go over a few simple rules of how it works:
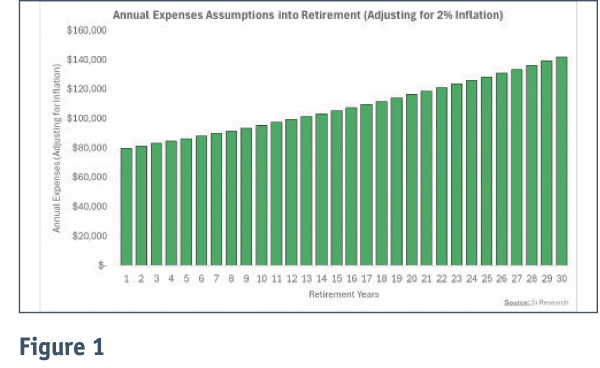
Annual Expenses in Retirement: This amount is calculated as the estimated annual after-tax amount that an individual plans to spend in retirement. A good rule of thumb for calculating this is 80% of what an individual spends annually today. For example, if an individual spends $100,000 annually after-tax today, in retirement they might plan for $80,000 annually. The math changes if the retirement is decades or more away, as these figures will need to be adjusted for inflation.
The 25X Rule – Estimated Total Retirement Portfolio: After an individual has estimated for their annual expenses, this figure is then multiplied by 25. Continuing with the $80,000 annual expense figure, this would work out to a retirement portfolio of $2,000,000 ($80,000 X 25).
The 4% Withdrawal Rate: After calculating estimated annual expenses and the 25X factor, the rule then works out to an individual being able to withdraw 4% of the initial retirement portfolio amount each year (e.g., $2,000,000 X 4% = $80,000). The one caveat to this rule is that the annual expense figure will increase by inflation each year (e.g., $80,000 in year 1, $81,600 in year 2, assuming a 2% inflation rate). The rule assumes a 30-year withdrawal period.
We also want to add the caveat that these are all very rudimentary assumptions, which do not take into account other factors such as Old Age Security (OAS), pensions, and other sources of income.
Our Case Study Back-Testing The Rule Of 25
For simplicity's sake, we will be using the figures from the introductory paragraph for our back-test study (i.e., $80,000 in annual expenses, $2,000,000 retirement portfolio, 2% inflation rate, etc.).
Figure 1 illustrates how these annual expenses would increase each year assuming a 2% inflation rate.
In the following sections we will be highlighting the results from our study, which analyzes how a retirement portfolio that uses the rule of 25 would have performed when invested in different broad asset classes over the past 35+ years. The study looks at how a $2 million portfolio would have performed after withdrawing $80,000 each year (adjusting for inflation each year) when factoring in the actual performance of the S&P 500, the Nasdaq 100, and the corporate bond market since 1985. For the S&P 500, we used data dating back to 1927, which we found to be quite insightful for the results. With that said, let’s dive into the results.
A 100% S&P 500 Portfolio
We first want to caveat that a 100% anything portfolio is quite risky, but given the strong performance of the S&P 500, we thought it would be interesting to see how the $2 million portfolio would have performed if it were solely invested in the S&P 500.
In Figure 2, we highlight the portfolio values for each year, starting in 1927 up until 2023 if the $2 million portfolio were 100% allocated to the S&P 500, receiving the S&P 500 distributions each year, withdrawing $80,000 at the beginning of the year, and adjusting for 2% inflation.
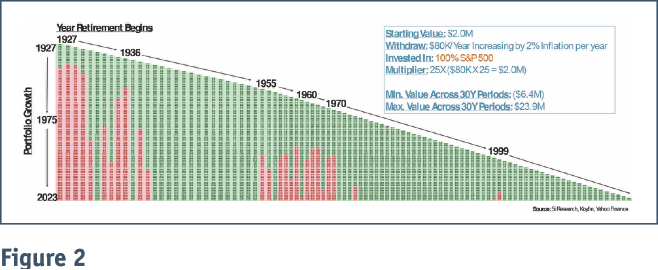
While the individual figures are illegible due to the sheer amount of data, what we want to specifically call out are the vertical columns that are red. For example, an investor that put $2 million into the S&P 500 in 1927, withdrawing $80,000 per year adjusted for inflation, would have run out of money within the first 15 years. Similar scenarios take place in 1928, 1929, 1930, 1935, 1936, 1965, 1998, and 1999. In a roughly 100-year span of time, investors beginning across nine different years would have run out of money before the 30-year period ended. This is roughly a 90% success rate, not bad all things considered.
A 100% U.S. Corporate Bond Portfolio
Again, we performed a similar study in Figure 3, but this time using a hypothetical 100% U.S. corporate bond portfolio, via the ICE BofA U.S. Corporate Total Return Index. Looking back to 1985, starting retirement in any year yielded a portfolio that consistently stayed above a $1.9 million value, and the maximum value across any 30-year investment period was $7.9 million.
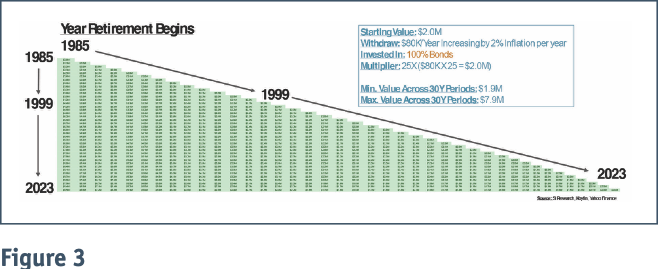
We can see that this slightly differs from the 100% S&P 500 portfolio, in which retiring in 1998 and 1999 resulted in an investor running out of money. Although, the maximum portfolio value is much higher than the 100% bond portfolio. But, as most investors know, the goal in retirement is not to maximize returns but rather to preserve capital.
A 50% S&P 500 and 50% Nasdaq 100 Portfolio
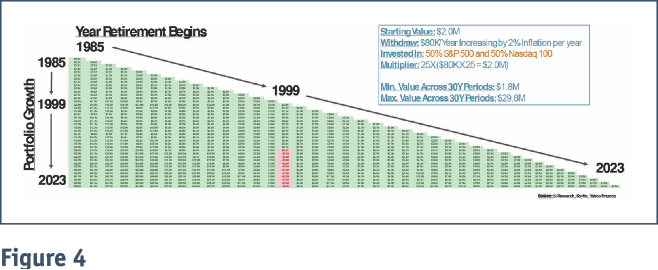
Now, we look at combining a few of these indices to see which portfolios may have retained and/or grown their values the best. In Figure 4 we look at a 50% S&P 500 and 50% Nasdaq 100 portfolio across all years since 1985. There is only one year in which an investor would have run out of money—a retirement beginning in 1999. The maximum portfolio value is higher than in a pure S&P 500 portfolio, but the combination of the S&P 500 and the Nasdaq 100 results in fewer instances of running out of money.
A 33% S&P 500, 33% Nasdaq 100, and 33% Bond Portfolio
Finally, in Figure 5, we highlight the strongest combination of indices. We found an equally weighted portfolio of the S&P 500, the Nasdaq 100, and bonds is the strongest. Across all years since 1985, the portfolio never ran out of money, while withdrawing 4% per year, the portfolio value never fell below $1.9 million, and the maximum value across any 30-year period was a strong $21.9 million.
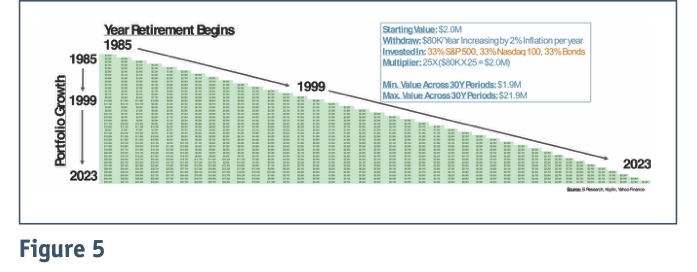
This makes a strong case for the benefits of diversification, by gaining the upside potential from equities while also benefiting from the downside protection that bonds can provide.
Summarizing It All Together
In Figure 6, we provide several stats including the average, minimum, and maximum 30-year portfolio ending value, the average, minimum, and maximum annual return, and more. We can see that the 100% bond portfolio had the smallest minimum annual return for highly risk-averse investors, but the equal-weight S&P 500, Nasdaq, and Bonds portfolios demonstrated a strong average return with a fairly balanced minimum annual return of only -29%.

While each investor will have their unique risk tolerances, investment goals, and preferences, given the results of the study, we feel there is strong evidence for a balanced portfolio into retirement which can benefit from the upside potential of equities and the minimal volatility of bonds. Encouragingly enough, the results showed that across any combination of investment portfolios, there are only a handful of years in which beginning a retirement would have resulted in an investor running out of money.
Chris White, CFA, Analyst for 5i Research Inc.